The Hockey Schtick:
Climate fraudsters like to claim that Earth began in 1979, the year of peak Arctic sea ice. The graph below shows why. If they started their graph in 1954, there would be almost no downwards trend to the present.
Reblogged from Global Warming Solved:
…The satellite records only began in October 1978, however. This coincided with the start of a recent warming trend in the Arctic. Before that, from the 1950s-1970s, Arctic temperatures were cooling. So, it is quite likely that in the decades immediately before the satellite records began, average Arctic sea ice extent was actually increasing, but we just weren’t monitoring it. It seems that the Arctic sea ice extent naturally goes through periods of expansion, followed by periods of contraction.
In case you’re unsure about which is which, the Arctic is the polar region in the north (the one with polar bears, etc.) and the Antarctic is the polar region in the south (the one with penguins, etc.)
In this essay, we look at what we know about Arctic sea ice extent.
1. The satellite era
2. What do we know about Arctic temperatures?
3. The pre-satellite era
4. The great Arctic explorers
5. Conclusions1. The satellite era
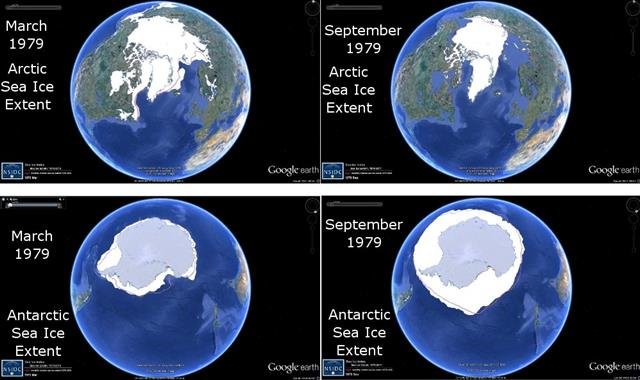
Every winter, the sea ice in the polar regions grows, but then in the summer, it melts again.
Figure 1. Minimum and maximum sea ice extents for northern and southern hemispheres in 1979. Click to enlarge.Since winter and summer are reversed between the southern and northern hemispheres, this means that as the Arctic sea ice reaches its maximum extent in March, the Antarctic sea ice is reaching its minimum extent. By September, the situation has reversed (minimum Arctic and maximum Antarctic sea ice). This can be seen from the Google Earth images in Figure 1 (generated using data from NSIDC).
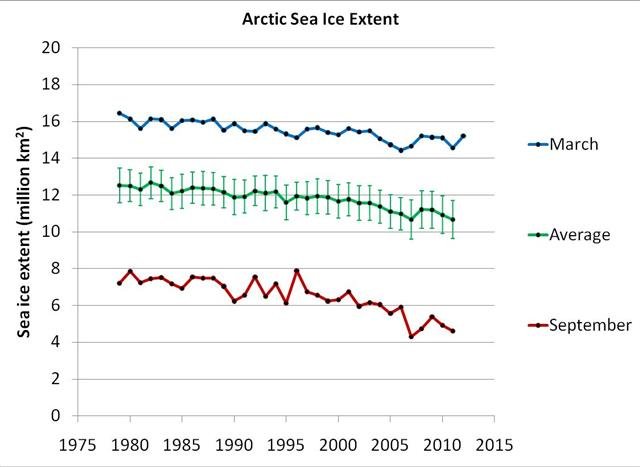
Figure 2. Trends in maximum (March), minimum (September) and average annual sea ice extents for the Arctic, since records began in 1979. Error bars for the average value correspond to the standard errors. Click to enlarge.This cyclical pattern occurs every year. However, since satellite records began in 1979, the maximum (March) and minimum (September) sea ice extents in the Arctic seem to have been gradually decreasing. This can be seen from Figure 2 (generated using NSIDC data).This has led many people to worry that it is man-made global warming which is causing the Arctic sea ice to melt, and that humans are therefore destroying an entire ecosystem, threatening animals such as polar bears.
As a result, much of the research in the Arctic in recent years has become dominated by a heavy focus on man-made global warming, rather than studying the Arctic as a fascinating region in itself.
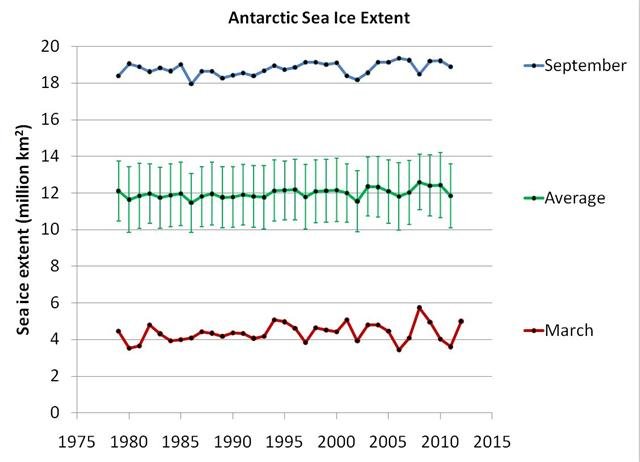
Figure 3. Trends in maximum (September), minimum (March) and average annual sea ice extents for the Antarctic, since records began in 1979. Error bars for the average value correspond to the standard errors. Click to enlarge.Interestingly, even though you might expect “global” warming to occur globally, in the southern half of the world, the Antarctic sea ice extent doesn’t seem to have changed much (see Figure 3). This apparent paradox has puzzled those who believe the Arctic melting is due to man-made global warming.As a result, some groups have struggled to come up with explanations as to why man-made global warming is not causing melting of Antarctic sea ice. For example, Zhang, 2007 (Open access) proposed that warmer waters off Antarctica might make the water less salty, and that maybe this would stop the ice from melting. We believe a much simpler explanation is that the changes in the Arctic sea ice arenot due to the “man-made global warming” assumed by current climate models. If the explanation is not “CO2-related”, then we would no longer need to worry about why the models don’t match the data – it would just mean that the models are wrong.
At any rate, since the Antarctic sea ice extent doesn’t seem to be declining, the public concern over sea ice seems to be confined to the Arctic. With that in mind, let us limit our discussion in this essay to the Arctic, i.e., the region which has shown a decrease in polar sea ice. The fact that the Arctic sea ice seems to have been steadily decreasing “since records began” does initially seem alarming. However, as we will see below, this is because “the records” only began in October 1978, as the satellites weren’t launched until then.
There may be some problems with the satellite estimates of sea ice extent, e.g., see here. Estimating sea ice extent from satellites is a complex problem – the satellites aren’t actually photographing the amount of ice, so it’s not a simple case of looking at a photograph and saying “oh, there’s some ice there, and none there”.
Instead, they measure microwave emissions. Analysts then try to convert those measurements into estimates of sea ice. These conversions rely on several different assumptions being valid. If there are problems with those assumptions, it may affect the reliability of the satellite estimates.
However, for the purposes of this post, we assume that the satellite estimates are reliable.
2. What do we know about Arctic temperatures?
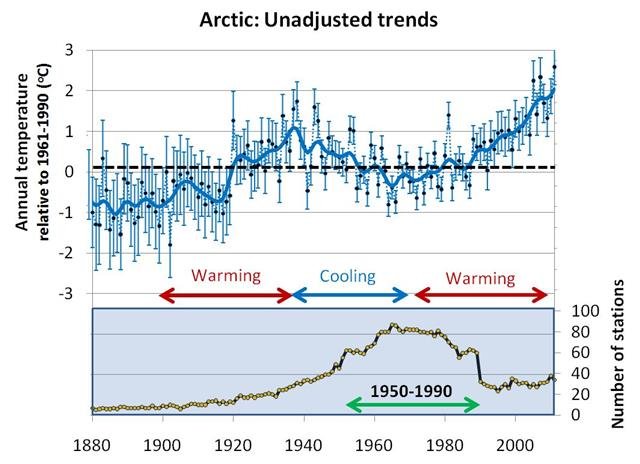
Figure 4. Top panel: Unadjusted average temperature trends of all GHCN stations in the Arctic Circle. Thick solid line corresponds to a smoothed average (11 point binomial). Bottom panel: Number of stations available in a given year. Taken from our Urbanization bias III paper. Click to enlarge.In Figure 4, the average annual temperature trends for the Arctic are shown (the graph is taken from our “Urbanization bias III” paper – Provide link!). We can see that there has indeed been a warming trend since the late 1970s. However, if we look at the rest of the data, the problem of the sea ice record only beginning in 1979 should become obvious – the warming trend since the 1970s followed acooling trend from the 1940s. If the sea ice records had started just a bit earlier, they would probably have first shown sea ice growth!Before the 1940s-1970s Arctic cooling, there also seems to have been another warming period (1900s-1930s). We do not have enough weather records to reliably tell what happened to Arctic temperatures before the 20th century, but it is at least plausible that similar cooling and warming periods also occurred then. It seems that temperatures in the Arctic naturally alternate between periods of warming and periods of cooling.