James Delingpole:
You’ve read about the climate fraud committed ‘on an unbelievable scale’ by the shysters at NASA.
You’ve read about how NOAA overestimated US warming by 50 percent.
Now it’s NSIDC’s turn to be caught red-handed fiddling the data and cooking the books.
NSIDC – National Snow and Ice Data Center – is the US government agency which provides the official statistics on such matters as sea ice coverage in the Arctic.
Naturally its research is of paramount importance to the climate alarmists’ narrative that man-made global warming is causing the polar ice caps to melt. At least it was until those ice caps refused to play ball…
Where the alarmists have for years been doomily predicting ice free summers in the Arctic – according to Al Gore in 2007, 2008 and 2009 it would be gone by 2013 – the truth is that multi-year ice has been staging a recovery since 2009.
So what do you do if reality doesn’t suit your narrative? Simple. If you’re NSIDC (and NASA and NOAA…) you just change reality.
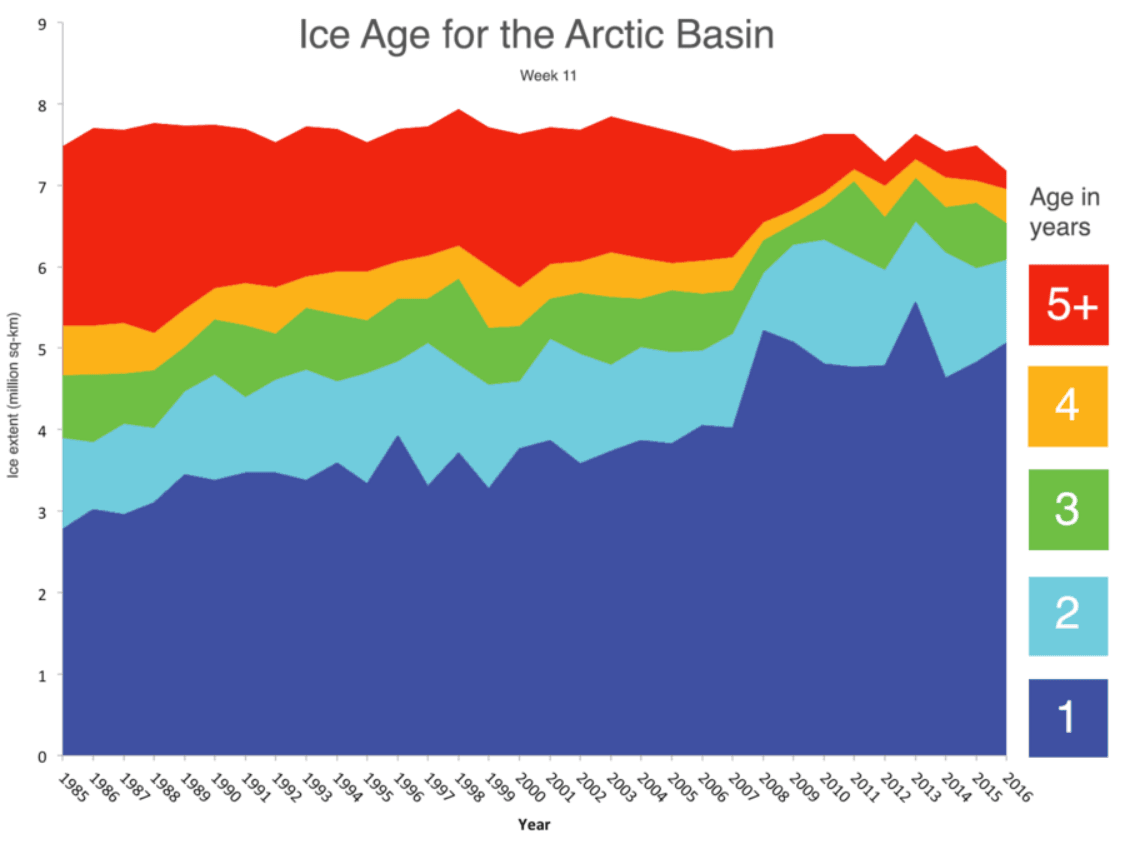
NSIDC’s latest attempt to breathe new life into the corpse of the alarmist narrative comprised a press release a few weeks ago claiming that 5+ year old sea ice is at its smallest level on record. To prove it, they’ve produced a new chart that looks like this.
But according to Steven Goddard of the Real Science website this claim needs to be taken with a huge pinch of salt.
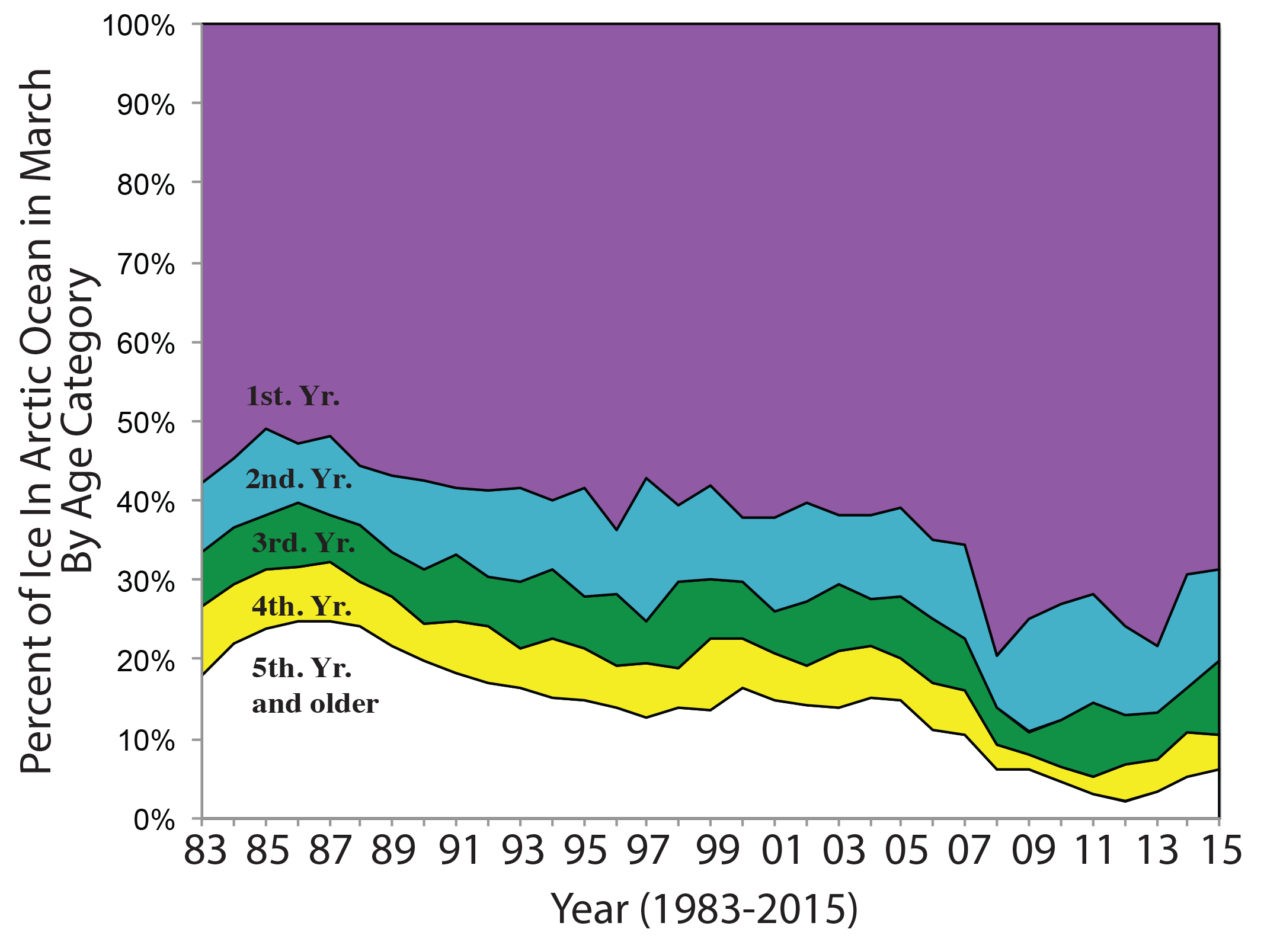
Note how, to confuse matters, NSIDC have upended their chart so that 5+ year ice instead of being at the bottom is now at the top. Far worse, though, they’ve gone and deleted all the old style maps from their archive.
At least they thought they had.
But a sharp eyed reader of Goddard’s managed to find one old style map that NSIDC had forgotten to delete. This enabled Goddard to compare the new style map with an old style map for the same week. What he discovered is that NSIDC has been making some dramatic and unexplained adjustments to the record: about half the 5+ year sea ice which should be there, for example, has been mysteriously erased.
Here is a chart Goddard has composed showing the differences.