


Since warming hasn’t been cooperating lately, in desperation, Yale and George Mason University are trying to use a poorly wording and loaded poll to convince us that “weather is climate”. Problem is, the data does not support it.
Here’s the poll released today:


Just looking at the cover tells you a lot, it’s about the imagery of fear and terror, not facts.
Here’s a quote from the many news stories being circulated today in the MSM:
“Most people in the country are looking at everything that’s happened; it just seems to be one disaster after another after another,” said Anthony A. Leiserowitz of Yale University, one of the researchers who commissioned the new poll. “People are starting to connect the dots.”
Well by all means, let’s “connect the dots”, but let’s use history and data rather than sloppy questions like this:

What’s hilarious about this question is that the memory of such events is aided by the stories in the mainstream media, and what we are seeing is a positive feedback loop. More on that below.
These are probably the most pointless and loaded questions ever to be put into a poll about weather, why? because short term memory is better than long term, and they play into this fact, biasing the results strongly. Plus, it has been shown that bad weather itself affects memory:
“We predicted and found that weather-induced negative mood improved memory accuracy,” he wrote in the study, which is published in the currentJournal of Experimental Social Psychology.
Another study from the University of Toronto has also shown a link between bad moods and ability to remember details.
Forgas speculated that a worse mood helps us to focus our attention on the surroundings and leads to a more thorough and careful thinking style, while happiness tends to reduce focus and increase both confidence and forgetfulness.
Yale makes no mention of this psychological tendency to remember better in bad weather in their study, nor do they correct for it. So then, it is no surprise to see results like this for weather in the last year:

I’d really like to see what the last 10 years looks like in a similar question…but they wouldn’t dare do that, because it would not give the results they seek. Plus, the type of severe weather events listed above, have regional distributions. For example, the south far more likely to have tornadoes and hurricanes that the Pacific Northwest. And in any given year, a strong wind and a strong rainstorm are common events just about anywhere, yet they try to make normal weather part of the “extreme” weather pattern, without defining what “extreme” weather is to the person being polled.
But, by saying “we are taking a poll about extreme weather” and then including winds, rain, snowstorms, heat waves, cold snaps, etc, which are regular occurances, lumping them with tornadoes, hurricanes, etc…they bias the poll by association. Its a clever trick, and it is also dishonest.
And in a hat tip to the slimy “forecast The Facts” campaign against TV weathercasters that don’t “toe the line” on saying garbage like this, here’s the poll’s hat tip to that paid political ploy run by the Center for American Progress:

In stark contrast the the agenda filled Yale poll by Anthony A. Leiserowitz, a Gallup poll from last week says that American don’t seem much concerned about global warming at all. In fact it is dead last in the concerns.
This is why warmists need a new ploy, if they can make global warming about everyday weather, they’ll have a golden hammer. In my opinion, it is psychological terrorism.
Ok let’s look at that positive feedback loop of opinion aided by the MSM I mentioned earlier. For that, I’m reposting portions of:
Why it seems that severe weather is “getting worse” when the data shows otherwise – a historical perspective
Published in April 2011
Bouziotas et al. presented a paper at the EGU a few weeks ago (PDF) and concluded:
Analysis of trends and of aggregated time series on climatic (30-year) scale does not indicate consistent trends worldwide. Despite common perception, in general, the detected trends are more negative (less intense floods in most recent years) than positive. Similarly, Svensson et al. (2005) and Di Baldassarre et al. (2010) did not find systematical change neither in flood increasing or decreasing numbers nor change in flood magnitudes in their analysis.
Note the phrase I highlighted: “Despite common perception”. I was very pleased to see that in context with a conclusion from real data.
That “common perception” is central to the theme of “global climate disruption”, started by John P. Holdren in this presentation, which is one of the new buzzword phrases after “global warming” and “climate change” used to convey alarm.
Like Holdren, many people who ascribe to doomsday scenarios related to AGW seem to think that severe weather is happening more frequently. From a perception not steeped in the history of television technology, web technology, and mass media, which has been my domain of avocation and business, I can see how some people might think this. I’ve touched on this subject before, but it bears repeating again and in more detail.
Let’s consider how we might come to think that severe weather is more frequent than before. Using this Wikipedia timeline as a start, I’ve created a timeline that tracks the earliest communications to the present, adding also severe weather events of note and weather and news technology improvements for context.
- Prior to 3500BC – Communication was carried out through paintings of indigenous tribes.
- 3500s BC – The Sumerians develop cuneiform writing and the Egyptians develophieroglyphic writing
- 16th century BC – The Phoenicians develop an alphabet
- AD 26-37 – Roman Emperor Tiberius rules the empire from island of Capri by signaling messages with metal mirrors to reflect the sun
- 105 – Tsai Lun invents paper
- 7th century – Hindu-Malayan empires write legal documents on copper plate scrolls, and write other documents on more perishable media
- 751 – Paper is introduced to the Muslim world after the Battle of Talas
- 1305 – The Chinese develop wooden block movable type printing
- 1450 – Johannes Gutenberg finishes a printing press with metal movable type
- 1520 – Ships on Ferdinand Magellan‘s voyage signal to each other by firing cannon and raising flags.
- 1776 The Pointe-à-Pitre hurricane was at one point the deadliest Atlantic hurricane on record. At least 6,000 fatalities occurred on Guadeloupe, which was a higher death toll than any known hurricane before it. It also struck Louisiana, but there was no warning nor knowledge of the deaths on Guadeloupe when it did. It also affected Antigua and Martinique early in its duration.
- 1780 – The Great Hurricane of 1780, also known as Hurricane San Calixto is considered the deadliest Atlantic tropical cyclone of all time. About 22,000 people died when the storm swept over Martinique, St. Eustatius and Barbados between October 10 and October 16. Thousands of deaths also occurred offshore. Reports of this hurricane took weeks to reach US newspapers of the era.
- 1793 – Claude Chappe establishes the first long-distance semaphore telegraph line
- 1812 – The Aug. 19, 1812 New Orleans Hurricane that didn’t appear in the Daily National Intelligencer/(Washington, DC) until later September. Daily National Intelligencer. Sept. 22, 1812, p. 3. Dreadful Hurricane. The following letters present an account of the ravages of one of those terrific storms to which the Southern extreme of our continent is so subject. Extract of a letter from Gen. Wilkinson, dated New Orleans, August 22.
- 1831 – Joseph Henry proposes and builds an electric telegraph
- 1835 – Samuel Morse develops the Morse code
- 1843 – Samuel Morse builds the first long distance electric telegraph line
- 1844 – Charles Fenerty produces paper from a wood pulp, eliminating rag paper which was in limited supply
- 1849 – Associated Press organizes Nova Scotia pony express to carry latest European news for New York newspapers
- 1851 – The New York Times newspaper founded
- 1876 – Alexander Graham Bell and Thomas A. Watson exhibit an electric telephone inBoston
- 1877 – Thomas Edison patents the phonograph
- 1889 – Almon Strowger patents the direct dial telephone
- 1901 – Guglielmo Marconi transmits radio signals from Cornwall to Newfoundland
- 1906 – Reginald Fessenden used a synchronous rotary-spark transmitter for the first radio program broadcast, from Ocean Bluff-Brant Rock, Massachusetts. Ships at sea heard a broadcast that included Fessenden playing O Holy Night on the violin and reading a passage from the Bible.
- 1914 – teletype intrduced as a news tool The Associated Press introduced the “telegraph typewriter” or teletype into newsrooms in 1914, making transmission of entire ready to read news stories available worldwide.
- 1920 – The first radio news program was broadcast August 31, 1920 by station 8MK in Detroit, Michigan, which survives today as all-news format station WWJ under ownership of the CBS network.
- 1925 – John Logie Baird transmits the first television signal
- 1928 – NBC completed the first permanent coast-to-coast radio network in the United States, linked by telephone circuits
- 1935 – Associated Press launched the Wirephoto network, which allowed transmission of news photographs over telephone lines on the day they were taken.
- 1942 – Hedy Lamarr and George Antheil invent frequency hopping spread spectrumcommunication technique
- 1946 – The DuMont Television Network, which had begun experimental broadcasts before the war, launched what Newsweek called “the country’s first permanent commercial television network” on August 15, 1946
- 1947 – Douglas H. Ring and W. Rae Young of Bell Labs proposed a cell-based approach which lead to “cellular phones“
- 1947 – July 27th. The WSR-1 weather surveillance radar, cobbled together from spare parts of the Navy AN/APS-2F radar was put into service in Norfolk, NE. It was later replaced by improved models WSR-3 and WSR-4
- 1948 – Network TV news begins. Launched in February 1948 by NBC, Camel Newsreel Theatre was a 10-minute program anchored by John Cameron Swayze, and featured newsreels from Movietone News. CBS soon followed suit in May 1948 with a 15-minute program, CBS-TV News, anchored by Douglas Edwards and subsequently renamed Douglas Edwards with the News.
- 1948 – The first successful “tornado forecast” issued, and successfully predicted the 1948 Tinker Air Force Base tornadoes which were two tornadoes which struck Tinker Air Force Base in Oklahoma City, Oklahoma on March 20 and March 25.
- In 1953, Donald Staggs, an electrical engineer working for the Illinois State Water Survey, made the first recorded radar observation of a “hook echo” associated with a tornadic thunderstorm.
- 1957 the WSR-57 the first ‘modern’ weather radar, is commissioned by the U.S. Weather Bureau
- 1958 – Chester Carlson presents the first photocopier suitable for office use
- 1960 – TIROS-1 the first successful weather satellite, and the first of a series ofTelevision Infrared Observation Satellites, was launched at 6:40 AM EST[1] on April 1, 1960 from Cape Canaveral, Florida.
- 1962 – The first satellite television signal was relayed from Europe to the Telstarsatellite over North America.
- 1963 – First geosynchronous communications satellite is launched, 17 years afterArthur C. Clarke‘s article
- 1963 CBS Evening News establishes the standard 30 minute network news broadcast. On September 2, 1963, the show expanded from 15 to 30 minutes.
- 1966 – Charles Kao realizes that silica-based optical waveguides offer a practical way to transmit light via total internal reflection
- 1967 – The National Hurricane Center is established in the Miami, FL National Weather Service Forecast Office.
- 1969 – The first hosts of ARPANET, Internet‘s ancestor, are connected.
- 1969 – August 14-22 Hurricane Camille, a Category 5 storm, gets widespread network news coverage from correspondents “on the scene”.
- 1969 – Compuserve, and early dialup text based bulletin board system is launched in Columbus, Ohio, serving just that city with a
- 1971 – Erna Schneider Hoover invented a computerized switching system for telephone traffic.
- 1971 – Ray Tomlinson is generally credited as having sent the first email across a network, initiating the use of the “@” sign to separate the names of the user and the user’s machine.
- 1972 – Radio Shack stores introduce “The Weather Cube”, the first mass marketed weather alert radio. (page 77 here) allowing citizens to get weather forecasts and bulletins in their home for only $14.95
- 1974 April 3rd – WCPO-TV in Cincinnati carries the “Sayler Park Tornado” live on television as it was crossing the Ohio river. It was part of the biggest tornado super outbreak in history. It is the largest tornado outbreak on record for a single 24-hour period. From April 3 to April 4, 1974, there were 148 tornadoes confirmed in 13 US states. Lack of timely warnings demonstrated the need for an expanded NOAA weather radio warning system.
- 1974 – The first Synchronous Meteorological Satellite SMS-1 was launched May 17, followed later by GOES-1 in 1975.
- 1974 the WSR-74 the second modern radar system is put into service at selected National Weather Service office in the United States and exported to other countries.
- 1975 – The Altair 8800, the world’s first home computer kit was introduced in the January edition of popular electronics
- 1975-1976 NOAA Weather Radio network expanded from about 50 transmitters to 330 with a goal of reaching 70 percent of the populace with storm warning broadcasts.
- 1977 – Radio Shack introduces a weather radio with built in automatic alerting that will sound off when the National Weather Service issues an alert on the new expanded NOAA Weather Radio network with over 100 stations. Page 145 here
- 1977 – The Apple II, one of the first highly successful mass-produced home microcomputers was introduced.
- 1978 – NOAA Weather Radio receivers with automatic audio insertion capabilities for radio and TV audio began to become widely installed.
- 1979 – The first commercially automated cellular network (the 1G) was launched in Japan by NTT in 1979, initially in the metropolitan area of Tokyo. Within five years, the NTT network had been expanded to cover the whole population of Japan and became the first nationwide 1G network.
- 1980 – Cable News Network (CNN) is founded by Ted Turner.Upon its launch, CNN was the first channel to provide 24-hour television news coverage, and the first all-news television channel in the United States.
- 1980 – A heatwave hit much of the United States, killing as many as 1,250 people in one of the deadliest heat waves in history.
- 1981 – Home satellite dishes and receivers on C-band start to become widely available.
- 1981 – The IBM Personal Computer aka IBM model number 5150, and was introduced on August 12, 1981, it set a standard for x86 systems still in use today.
- 1982, May 2nd – The Weather Channel (TWC) is launched by John Coleman and Joe D’Aleo with 24 hour broadcasts of computerized weather forecasts and weather-related news.
- 1983 – Sony released the first consumer camcorder—the Betamovie BMC-100P
- 1983 America Online (then as Control Video Corporation, Vienna, Virginia) debuts as a nationwide bulletin board system featuring email.
- 1983 – The first 1G cellular telephone network launched in the USA was Chicago-based Ameritech using the Motorola DynaTAC mobile phone.
- 1984 – The Apple Macintosh computer, with a built in graphical interface, was announced. The Macintosh was introduced by the now famous US$1.5 million Ridley Scott television commercial, “1984“. The commercial most notably aired during the third quarter of Super Bowl XVIII on 22 January 1984 and is now considered a “watershed event”.
- 1985 – Panasonic, RCA, and Hitachi began producing camcorders that recorded to full-sized VHS cassette and offered up to 3 hours of record time. TV news soon began to have video of news and weather events submitted from members of the public.
- 1986 July 18th, KARE-TV in Minneapolis dispatches a news helicopter to catch live video of a tornado in progress, live at 5:13 PM during their news broadcast.
- 1988 – Doppler Radar goes national – the construction of a network consisting of 10 cm (4 in) wavelength radars, called NEXRAD or WSR-88D (Weather Service Radar 1988 Doppler), was started.
- 1989 – Tim Berners-Lee and Robert Cailliau built the prototype system which became the World Wide Web at CERN
- 1989 – August Sony announced the Sony ProMavica (Magnetic Video Camera) electronic still camera, considered the first widely available electronic camera able to load images to a computer via floppy disk.
- 1991 – Anders Olsson transmits solitary waves through an optical fiber with a data rate of 32 billion bits per second.
- 1991 – The 1991 Perfect Storm hits New England as a Category 1 hurricane and causes $1 billion dollars in damage. Covered widely in TV and print, it later becomes a movie starring George Clooney.
- 1992 – Neil Papworth sends the first SMS (or text message).
- 1992 – August 16-28 Hurricane Andrew, spotted at sea with weather satellites, is given nearly continuous coverage on CNN and other network news outlets as it approaches Florida. Live TV news via satellite coverage as well as some Internet coverage is offered. It was the first Category 5 hurricane imaged on NEXRAD.
- 1993 – The Great Mississippi Flood was carried on network television as levees breached, millions of viewers watched the flood in real-time and near real-time.
- 1994 – Internet2 organization created
- 1994 – Home satellite service DirecTV launched on June 17th
- 1994 – An initiative by Vice President Gore raised the NOAA Weather Radio warning coverage to 95 percent of the US populace.
- 1995 – The Weather Underground website was launched
- 1995 – DSL (Digital Subscriber Line) began to be implemented in the USA
- 1996 – Home satellite service Dish Network launched on March 4th
- 1996 – Fox News Channel was launched on October 7, 1996 with 24 hour news coverage
- 1996 – The Movie “Twister” was released on May 10, showing the drama and science of severe weather chasing in the USA midwest.
- 1999 – Dr. Kevin Trenberth posts a report and web essay titled The Extreme Weather Events of 1997 and 1998 citing “global greenhouse warming” as a cause. Trenberth recognizes “wider coverage” but dismisses it saying: “While we are indeed exposed to more and ever-wider coverage of the weather, the nature of some of the records being broken suggests a deeper explanation: that real changes are under way.”
- 2002 – Google News page was launched in March. It was later updated to so that users can request e-mail “alerts” on various keyword topics by subscribing to Google News Alerts.
- 2004 – December: A freak snowstorm hits the southernmost parts of Texas and Louisiana, dumping snow into regions that do not normally witness winter snowfall during the hours leading up to December 25 in what is called the 2004 Christmas Eve Snowstorm.
- 2004 – DSL began to become widely accepted in the USA, making broadband Internet connections affordable to most homes.
- 2004 – On November 19, the Website “Real Climate” was introduced, backed by Fenton communications, to sell the idea of climate change from “real scientists”.
- 2004 – December The website “Climate Audit” was launched.
- 2005 – August, Hurricane Katrina caused catastrophic damage along the Gulf Coast of the United States, forcing the effective abandonment of southeastern Louisiana (including New Orleans) for up to 2 months and damaging oil wells that sent gas prices in the U.S. to an all-time record high. Katrina killed at least 1,836 people and caused at least $75 billion US in damages, making it one of the costliest natural disasters of all time. TV viewers worldwide watched the storm strike in real time, Internet coverage was also timely and widespread.
- 2006 – Al Gore’s movie An Inconvenient Truth premiered at the 2006 Sundance Film Festival and opening in New York City and Los Angeles on May 24. It went on to limited theater release and home view DVD. It was the first entertainment film about global warming as a “crisis”, with hurricane Katrina prominently featured as “result” of global warming.
- 2006 – The short instant message service Twitter was launched July 15, 2006
- 2006 – November 17th, Watts Up With That was launched.
- 2007 – The iPhone, with graphics and Twitter instant messaging capabilities was released on June 29, 2007.
- 2007 – The reality show “Storm Chasers” debuts on the Discovery channel on October 17, 2007, showing severe weather pursuit as entertainment.
- 2007 – On October 10th, in Dimmock v Secretary of State for Education and Skills Al Gore’s AIT movie was challenged in a UK court, and found to have nine factual errors. It was the first time “science as movie” had been legally challenged.
- The 2008 Super Tuesday tornado outbreak was a deadly tornado outbreak affecting the Southern United States and the lower Ohio Valley from February 5 to February 6, 2008. With more than 80 confirmed tornados and 58 deaths, the outbreak was the deadliest in the U.S. since the May 31, 1985 outbreak that killed 76 across Ohio and Pennsylvania. It was widely covered live on US media.
- 2010 – A heat wave in Russia was widely reported by global media as being directly a result of “global warming”. Scientific research from NOAA released later in 2010 and2011 showed that to be a false claim.
- 2011 – On January 4th, the Pew Research Center released a poll showing that Internet had surpassed television as the preferred source for news, especially among younger people.
- 2011 – March, notice of an Earthquake off the coast of Japan was blogged near real-time thanks to a USGS email message alert before TV news media picked up the story, followed by A Tsunami warning. A Japanese TV news helicopter with live feed was dispatched and showed the Tsunami live as it approached the coast of Japan and hit the beaches. Carried by every major global news outlet lus live streamed on the Internet, it was the first time a Tsunami of this magnitude was seen live on global television before it impacted land.
Compare the reach and speed of communications and news reporting at the beginning of this timeline to the reach and speed of communications and news reporting technology around the beginning of the 20th century. Then compare that to the beginning of the 21st century. Compare again to what we’ve seen in the last 10 years.
With such global coverage, instant messaging, and Internet enabled phones with cameras now, is it any wonder that nothing related to severe weather or disaster escapes our notice any more? Certainly, without considering the technological change in our society, it would seem as if severe weather events and disasters are becoming much more frequent.
To borrow and modify a famous phrase from James Carville:
It’s the technology, stupid.
Which speaks to the phrase: “Despite common perception” which I highlighted at the beginning. The speed of weather tracking and communications technology curve aids in our “common perception” of severe weather events. The reality of severe weather frequency though, is actually different. While we may see more of it, that happens because there are millions more eyes, ears, cameras, and networks than ever before.
1. There are less Tornadoes in the USA

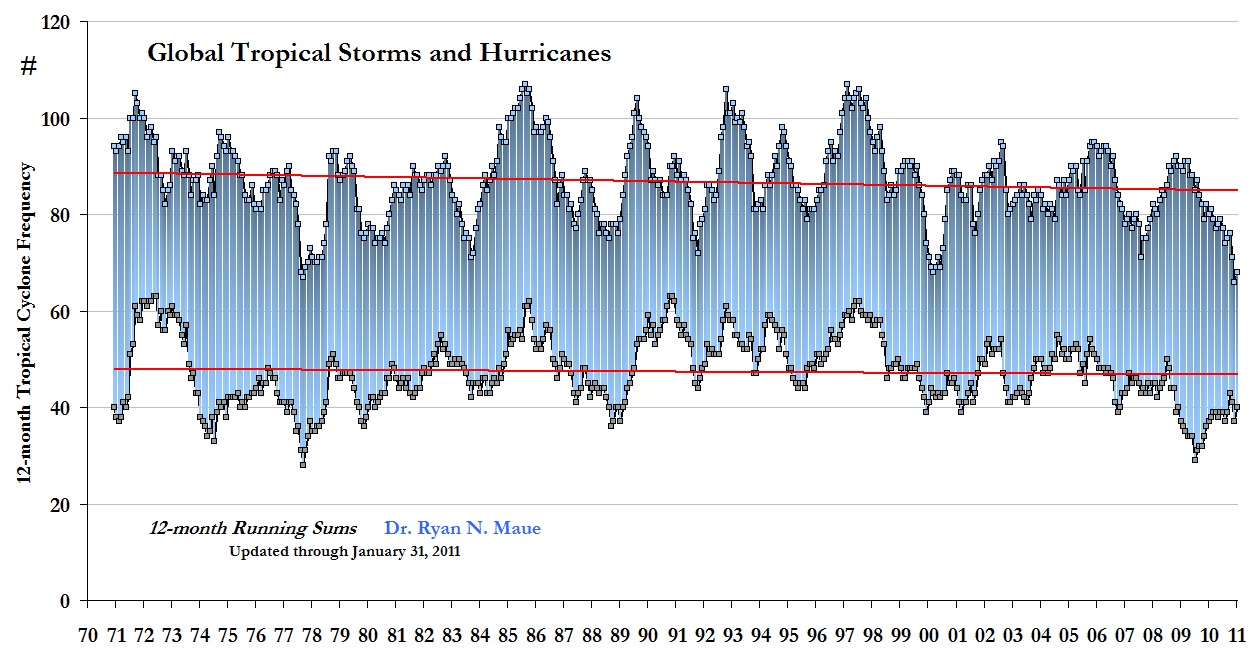
12-month running sums of hurricane frequency (Dr. Ryan N. Maue, FSU)
3. And now, back to our original seed for this long thread, no effect in global flooding events:
Destructive floods observed in the last decade all over the world have led to record high material damage. The conventional belief is that the increasing cost of floods is associated with increasing human development on flood plains (Pielke & Downton, 2000). However, the question remains as to whether or not the frequency and/or magnitude of flooding is also increasing and, if so, whether it is in response to climate variability and change.
Several scenarios of future climate indicate a likelihood of increased intense precipitation and flood hazard. However, observations to date provide no conclusive and general proof as to how climate change affects flood behaviour.
Finally, this parting note.
While our world has seen the explosion of TV news networks, Internet News websites. personal cameras and recording technology, smartphones with cameras, and the ability to submit a photo or movie or live video feed virtually anywhere, anytime, giving us reporting of weather and disaster instantly on the scene, where tornadoes live on TV is becoming a ho-hum event, there’s one set of elusive phenomena that still hasn’t seen an increase in credible reporting and documentation:
UFO’s, Loch Ness monster, and Bigfoot.
We still haven’t seen anything credible from the millions of extra electronic eyes and ears out there, and people still marvel over old grainy images. You’d think if they were on the increase, we’d know about it. 😉
==============================================================
And this article is also germane:
The Amazing Decline in Deaths from Extreme Weather in an Era of Global Warming, 1900–2010
Proponents of drastic curbs on greenhouse gas emissions claim that such emissions cause global warming and that this exacerbates the frequency and intensity of extreme weather events, including extreme heat, droughts, floods and storms such as hurricanes and cyclones. But what matters is not the incidence of extreme weather events per se but the impact of such events—especially the human impact. To that end, it is instructive to examine trends in global mortality (i.e. the number of people killed) and mortality rates (i.e. the proportion of people killed) associated with extreme weather events for the 111-year period from 1900 to 2010.

This is due to better warnings, and yes, the MSM (especially TV and radio) is key to getting those warnings out.
Here’s another germane article:
Another blow to warmist hysteria over weather is not climate unless we say it is: “2011 damage is qualitatively indistinguishable from 1974″
Simmons, K., D. Sutter, R.A. Pielke, Jr. (2012), Blown away: monetary and human impacts of the 2011 U.S. tornadoes. Extreme events and insurance: 2011 annus horribilis (Edited by C. Courbage and W.R. Stahel) The Geneva Reports: Risk and Insurance Research , Published March 2012.
Pielke Jr. writes on his blog:
1. When using our dataset, it is best to use the damage numbers as tabulated by the US NWS as they are consistent over time
2. That said, 2011 damage is qualitatively indistinguishable from 1974 and
19541953 at >;$20B3. That would give a simple baseline expectation of 1 in 20 for 2011, but half or twice that would not be implausible given the uncertainties, so between 1 in 10 and 1 in 40
4. For 2012 and looking ahead there are two big question marks, one more certain than the other. Urbanization is increasing, which means that the chance of large losses increases (somewhat at the expense of smaller and medium losses of course). And there has been a notable and significant decline in the incidence of strong tornadoes in recent decades
Here’s the summary from the report:
The decades leading up to 2011 convinced many that the tornado threat had been reduced to the point that 100 fatality tornadoes and 500 fatality years were in the past. After all, neither figure had been exceeded in the U.S. in over 50 years. The National Weather Service implemented a nationwide network of Doppler weather radars in the 1990s. Warning lead time doubled, and then almost doubled again, providing sufficient time for families to receive a warning and take shelter. Television stations used sophisticated graphics to cover tornadoes with ever-increasing accuracy. Street level tracking software allowed TV viewers to know the exact location of a tornado and how close it might get to their home.
In this environment, a tornado that killed 10 or more people was national news and could grab the attention of the public for days and perhaps weeks. In 1999 one of the most powerful tornadoes ever documented struck a metropolitan area and resulted in 36 deaths, which while tragic, was only a fraction of the toll that might have been expected from a tornado like this at the start of the 20th century. The benchmark for what constituted a major tornado event was much different than 1974, when the 3-4 April “Super Outbreak” killed over 300 people. Things were different now, or so many people thought.
We begin by summarising the damages and fatalities from U.S. tornadoes in 2011. Next, we examine the tornado outbreak as it relates to the historical record. The next section looks at the role that extreme weather played, followed by a discussion of some of the vulnerabilities that are known to increase fatalities from tornadoes. We then consider what can be done to limit damages and fatalities from future tornado outbreaks. Finally,
we discuss whether or not this was an event that can be expected to occur again and then we conclude.
…Three previous seasons—1953, 1965 and 1974—now rival damage in 2011. Normalised damage exceeded US$20 billion in 1953 and 1965 and exceeded US$10 billion in 1974. The 1953 season provides perhaps the best historical comparison with 2011, as much of the damage in 1965 and 1974 occurred in just one outbreak. Damage in 1965 is attributable to the Palm Sunday outbreak, while damage in 1974 occurred in the 2-3 April “Super Outbreak”. 1953 had multiple damaging outbreaks in different parts of the country. One of the worst tornadoes of 1953 occurred in Worcester, MA, and ranked first in normalised damage until the Joplin tornado of 2011.
===============================================================
Every time warmist academics try to push these ridiculous opinion polls as proof of “global warming makes weather more severe and more frequent” all it takes is a casual look at the data to know they are blowing hot air.
Crossposted from Watts Up With That