
![]()

When President Barack Hussein Obama tells you that “America is going back to work” he is lying. Additionally, the MSM is not telling the truth about unemployment.
The percentage of working age Americans that are employed is not increasing. In March 2010, 58.5% of all working age Americans had a job. In March 2012, 58.5% of all working age Americans had a job. So if the employment rate is exactly the same as it was two years ago, then how in the world can the Obama administration claim that things have gotten significantly better since then?
The Employment to Population Ratio, as it appears on this graph, fell to about 58.5% during the latest depression and has, under Obama, remained there. So even though the US population is growing, the jobs growth is absorbed by the population growth.
The last months have seen the unemployment rate drop from 8.3% for February, 2012, to 8.1% for April, 2012. How can that be, you ask? Well, the unemployment rate reported by the MSM, the “official” rate, is the U-3 rate. But that rate can be manipulated because it is calculated based on the “civilian labor force.” As Tyler Durden at zerohedge.com says, “… the reason why the unemployment dropped to 8.1% is that the labor force participation rate just dipped to a new 30 year low of 64.3%.” Be sure to look at the graphs Durden provides
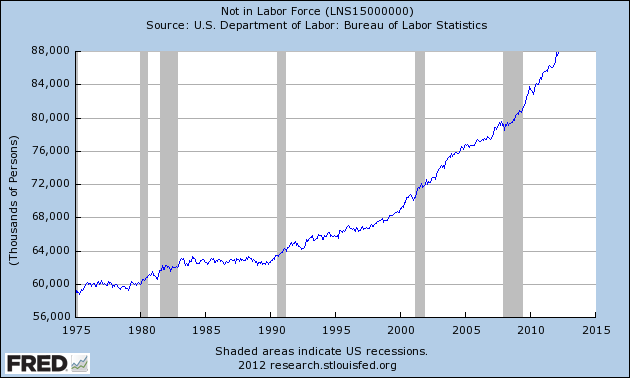
There are 12.6 million working age Americans that are considered to be “officially” unemployed, but there are another 87.8 million working age Americans that are not working either. The federal government considers those Americans to be “not in the labor force” so they are not included in the unemployment rate. This is one of the key ways that the government manipulates the U-3 unemployment rate. As this graph shows, the number of people not in the labor force continues to rise.
According to Annalyn Censky at CNNMoney, “About six million people claim they want a job, even though they haven’t looked for one in the last four weeks. If they were to all start applying for work again, the unemployment rate would suddenly shoot up above 11%.”
In 2007, approximately 10% of all unemployed Americans had been out of work for one year or longer. Now the rate is above 30%. The average duration of unemployment today is about three times as long as it was back in 2000. One of the biggest obstacles to an economic recovery has been solving the problem of the long-term unemployed, those out of work for 27 weeks or more. Aparna Mathur, an economist at the American Enterprise Institute, says “about 43% of the 12.8 million Americans officially labeled out of work fall into the category of the long-term unemployed, which is huge, we’ve never seen those kinds of numbers in any recession.”
The long-term unemployment problem is reflected in the U-6 unemployment rate. The U-6 rate tracks not only those out of work but those who have given up looking for work. The U-6 rate is today 15.5%, unchanged from last month, nearly double the “official” U-3 rate. Mathur continues, “If you’re unemployed and you haven’t been looking for work in the previous four weeks than you’re not considered part of the official unemployed.” The U6 rate, meanwhile, “includes all of those people who are too discouraged to look for work.”
But that’s just my opinion.
“It isn’t so much that liberals are ignorant. It’s just that they know so many things that aren’t so.” – Ronald Reagan

Good point that, IF we were really starting to get optimistic about jobs out there, many people on the sidelines as well as many underemployed in part-time or minimum wage jobs will start looking again.
THEN the unemployment rate would jump way up.
SO, obviously, we are NOT optimistic about finding work.
The Bureau of Labor Statistics has a table A-15.
Alternative measures of labor underutilization
It is worth looking at.
All those “U’s” are listed.
The U-3 we usually see (8.1% unemployment).
Also U-5 which adds back in the recently discouraged workers (9.5% unemployment).
And U-6 which adds in all discouraged workers (14.5% unemployment).
That adds up to 25 MILLION people and their families who Obama cannot lie to.
Obama is and has been a disaster for this country.
@Nan G: Those numbers do not reflect a recovery or a recession. They reflect a depression.
What does a depression look like?
Have you seen anything like that on the news lately?
It’s too bad we can’t run the nation’s transportation systems and factories on right wing hot air.
@Greg:
Actually, if the unemployment numbers truely reflected all the people the Obama administration has dropped from the work force rolls, we would be in Great Depression unemployment figures. Or do you think that all those people just went away or moved out of country?
@Greg:
Your god is still lying to you. How can you reconcile yourself with that?
No matter how you try and spin it, there are STILL more people out of work now than there were when Obama took office.
@Greg:Look at the U-6 unemployment numbers. Look at the chart linked here. Compare the numbers. They are very comparable. Pictures of how people lived in past times do not reflect the unemployment rate which is the topic. People were still shitting in outhouses in the 1920’s. Does that mean the unemployment rate was high? No. In fact it was quite low. Perhaps it was bad wording on my part and I should have clarified that the numbers are depression era numbers and not that we are in a depression.
http://www.u-s-history.com/pages/h1528.html
This is a tough call in reality, but the talking points for both sides will be predictable.
The right will be correct in noting that the shrinking labor force is undeniable… tho the absolute, and certainly not single, cause of that is harder to prove. The left will be coming up with the excuses for that decline, as Ezra Klein is already doing with his article, “The Incredible Shrinking Labor Force” yesterday in his WaPo blog – laying the bulk of that on boomers retiring. And they will also be partially correct.
As usual, the truth lies somewhere in the middle, and the genuine solutions are ignored – sacrificed for partisian political plays for power.
The labor force reached it’s peak in the year 2000, as ZeroHedge’s graph shows, and has been on the decline… save for a brief period a few years before the 2008 financial crash. But the reason the labor force has a predictably smaller size also has to do with the age demographics. The estimate is that boomers are retiring to the tune of 10,000 per day, or 3.65 mil annually – and that this will continue for another 19-20 years until the 77 mil boomers are no longer part of the active labor force. That might even be stepped up since the employment opportunities are so deplorable, the choice to work beyond early retirement age is no longer a feasible option.
As the below labor force prediction chart from a 2002 BLS report shows, we’ve just now entered a time when boomers are starting to retire en masse.
A smaller labor force creates a top heavy welfare system, making it tougher to sustain the entitlement programs which are structured to function on a ponzi scheme funding principle. With rising prices/inflation, plus the smaller labor force.. i.e. increased retirees on a fixed income… a large part of the nation will be consuming/spending less. If taxes are increased on the smaller productive workforce to cover the load, they will also be able to spend less.
Need I point out that consumer spending accounts for 2/3rds of our economy?
It was for this reason that they were lowering GDP growth expectations down to the 2.8% annually years ago, contrasting with the decades of over 3% growth prior. Yet if you’re going to reasonably assume less GDP growth, less spending, one also has to address a commensurate reduction in spending and debt to stay with sustainable parameters.
We all know we are no where close to that being done since none in Congress are serious about spending/debt/deficits because it sounds the death knell for their political careers. But until both parties come up with massive restructuring reform – and phasing out – of the entitlement programs , the USS Titantic is going to continue to take on water.
Oh yes. The entitlements account for over 65-66% of all US spending, so please… lib/progs with your predictable mantras, as well as the Paul supporters… spare me your “defense” and “wars” BS. Were these entitlements never in place, the US would not be floundering financially at all. The problem is a massive central government bureacracy that is bloated far outside the Constitutional enumerated powers
The new demographic shift is this:
Number of Americans Paid Not to Work Growing Faster than Number of Taxpayers
Some points:
That’s 14.2% !
More going on the dole than joining in paying to create the dole! Twice as many!
The author, Chuck DeVore, asks:
Nope.
We have created a victim culture.
These are just ti tip of the iceberg of those who bought that lie.
Nan G, leaving aside retirees, going on the SS system early as opposed to working longer because they can’t find a job… I actually know a couple of people that are playing the SS disability game, as well as educational grants game. What their story is they are so frustrated that work is unavailable, and considering they can’t change the nanny welfare state direction, they are taking advantage of it instead because of what they see as no other option. While I agree the practice is becoming more common, to the drain of the nation’s coffers, not all are doing so for sinister reasons… like being lazy. None of those I know doing this are of the welfare mentality by nature.
What also needs to be noted is that the medical professionals are enabling their ability to do so by documenting such “disabilities” in writing, which is required to draw the benefits. Sometimes I wonder if we all aren’t about to reach those crossroads in the future for similar reasons. Retiring early, even for less pension income for SS, looks inviting if you suspect SS will no longer be there down the road. Or that they will continually move the retirement age goal posts, making everyone chase it in an era when employment is tough to secure.